Story Map
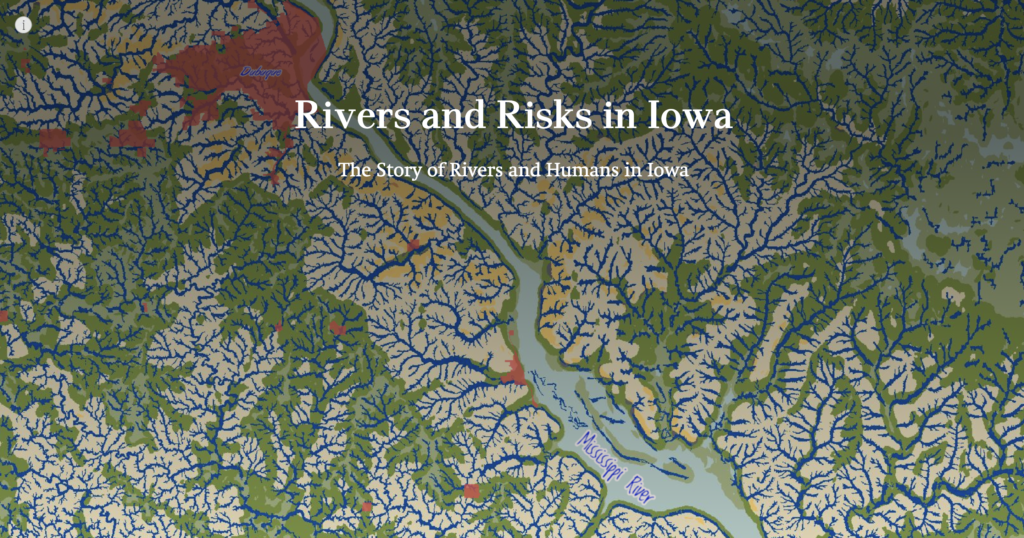
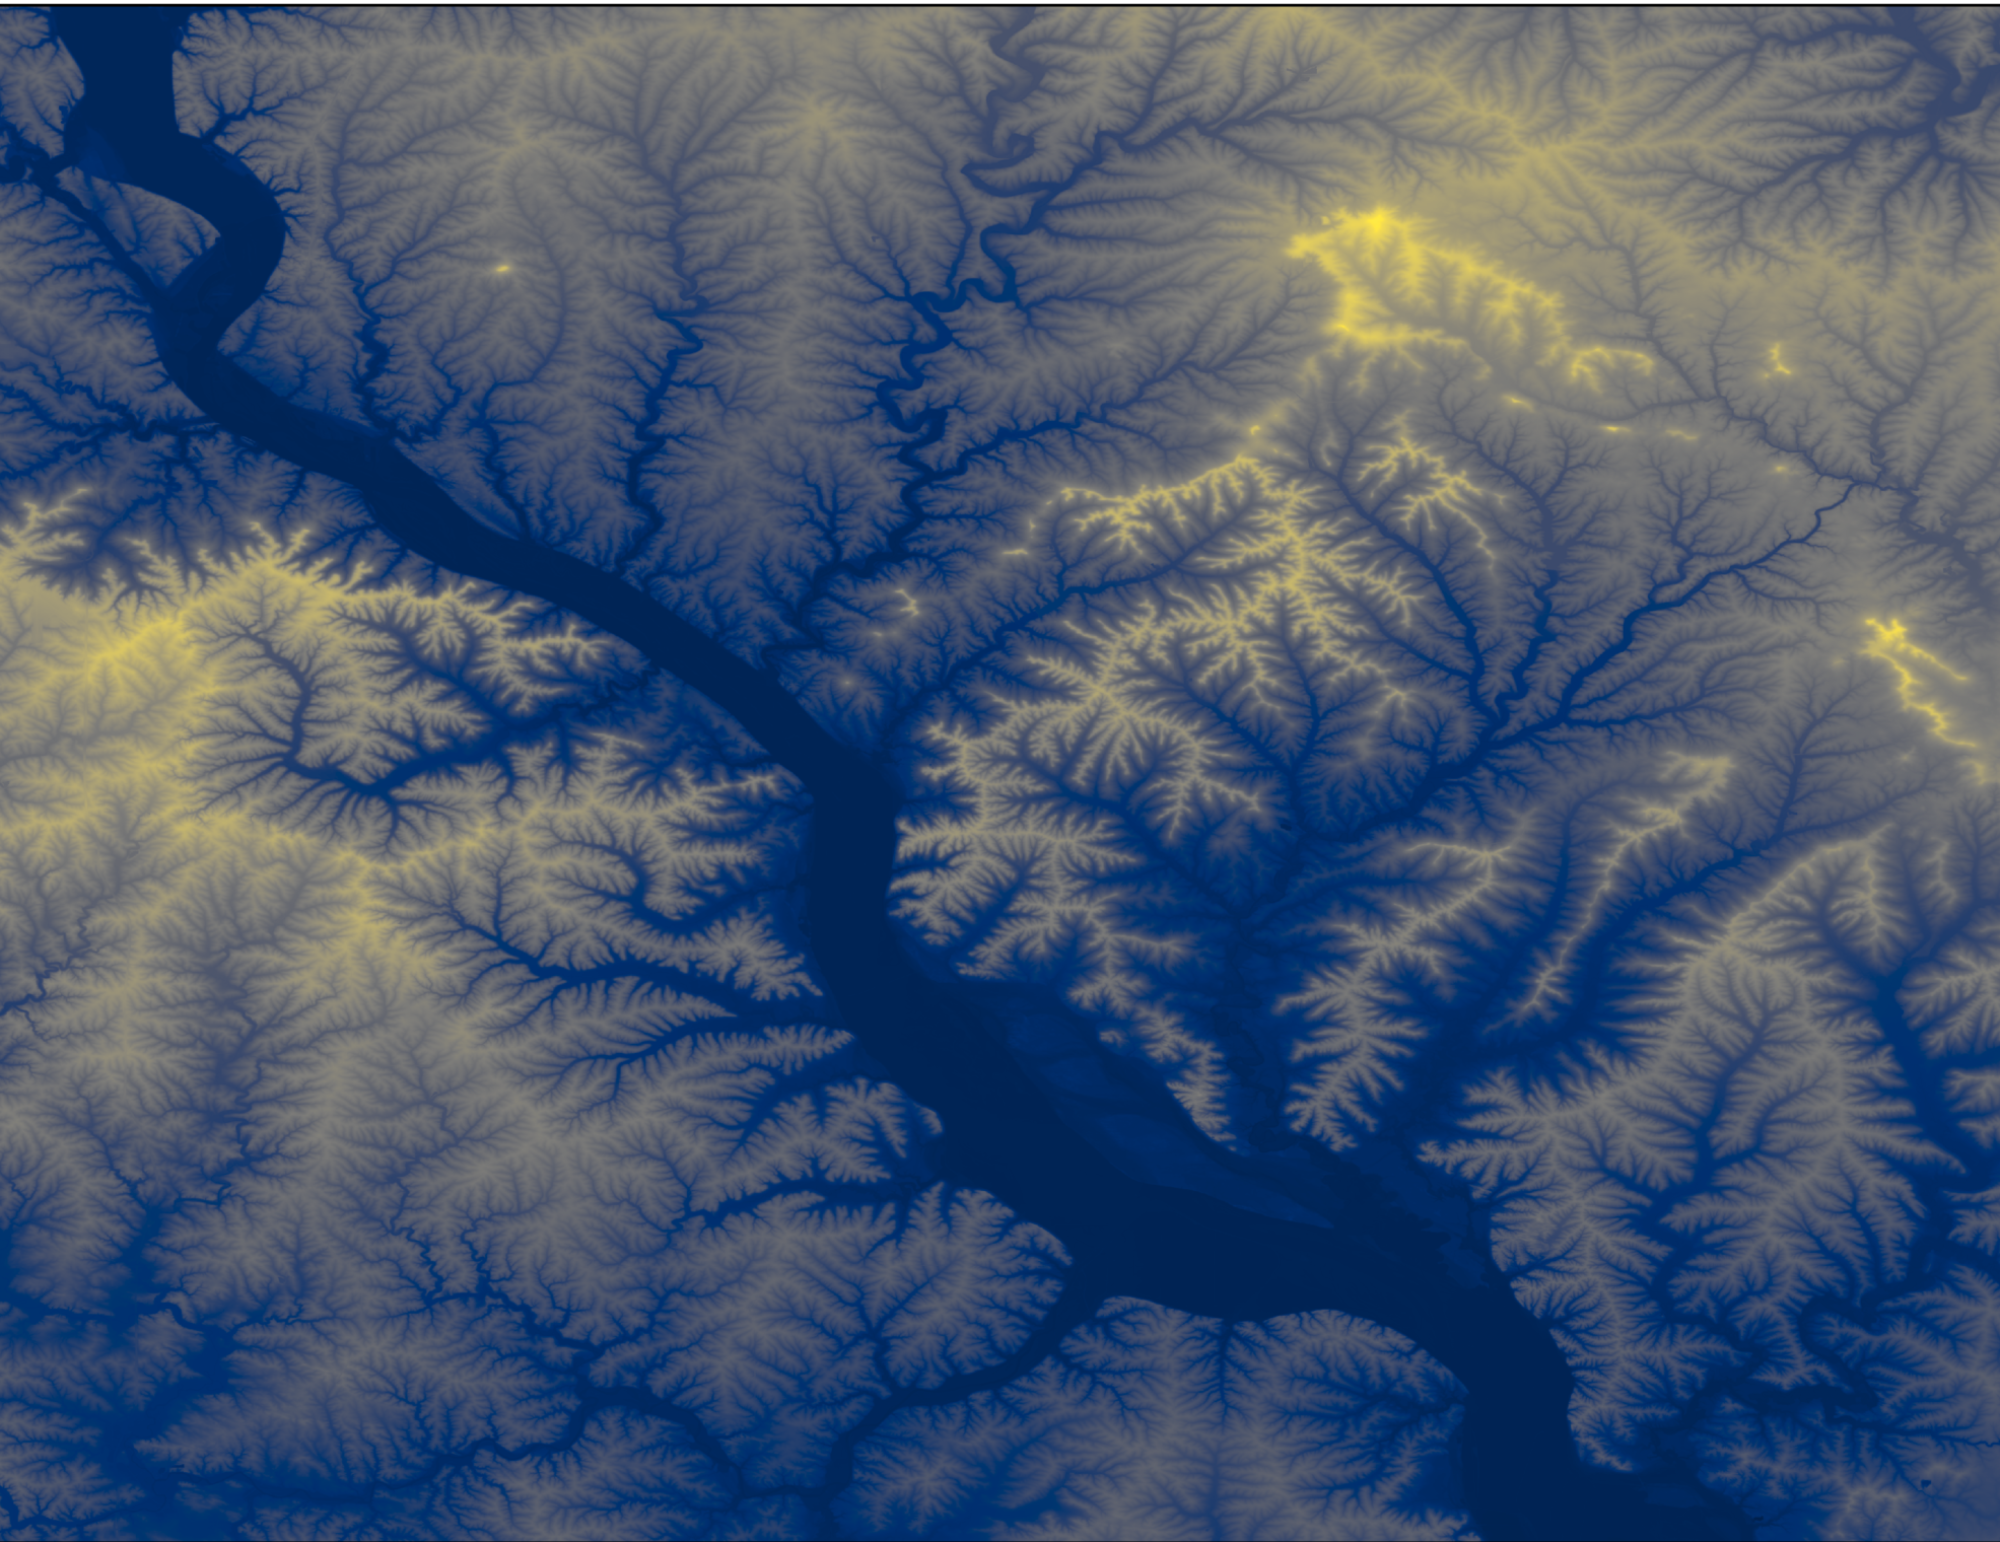
As part of the NSF-funded BluGAP project, I developed the “Rivers and Risks” interactive story map to bridge the gap between spatial analysts and watershed communities and foster collaboration in river protection.
Skills: Geospatial Analysis, Map Design, Cartography, Visual storytelling.
Tools: ArcGIS Pro, ArcGIS Online, ArcGIS StoryMaps, ArcGIS Survey123.
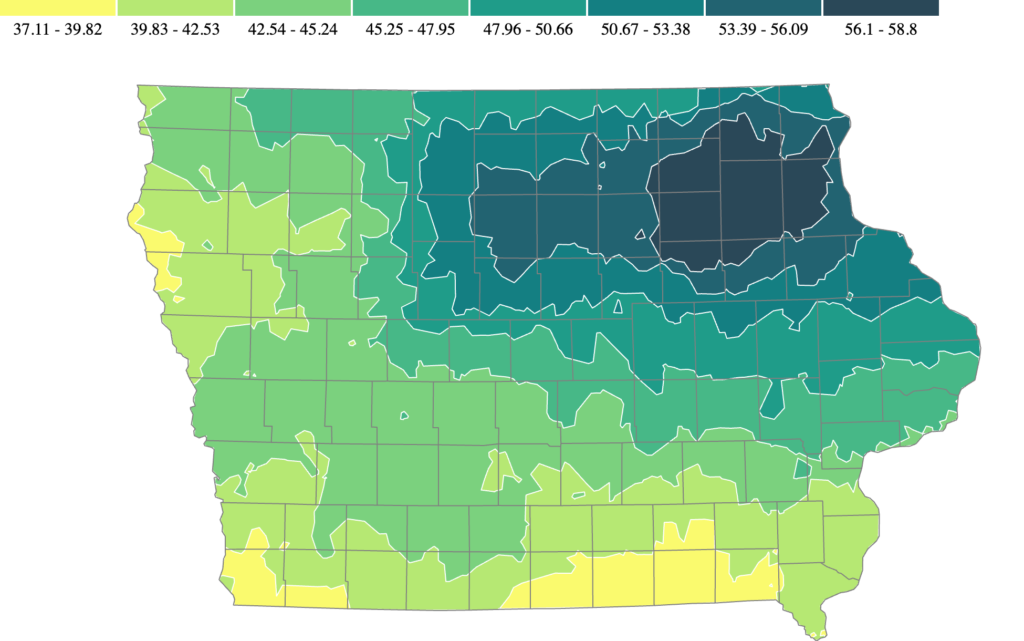
Animated Map
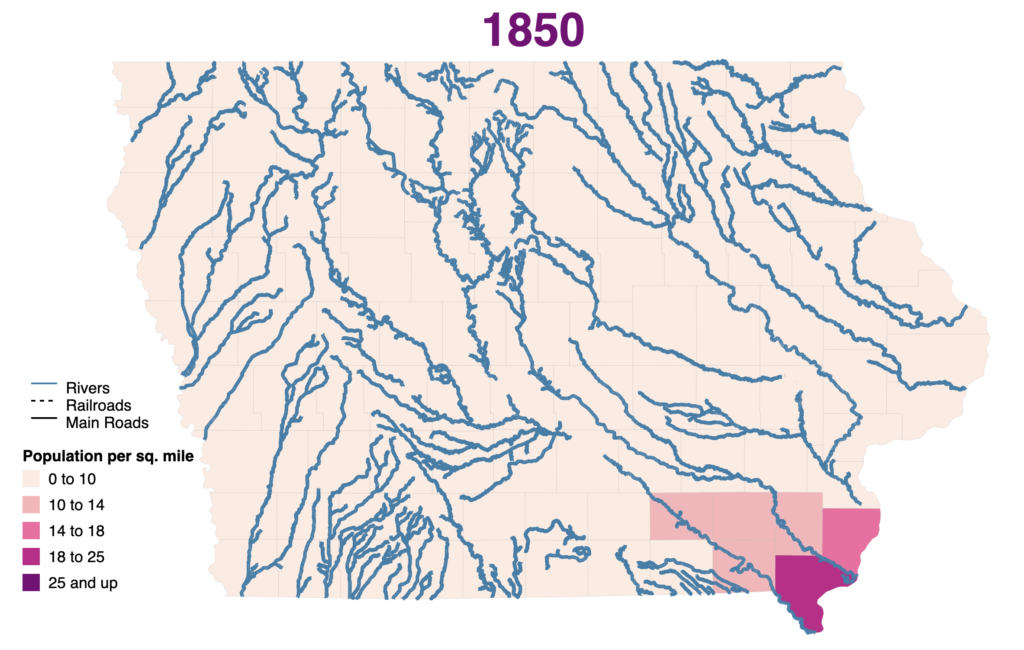
Animated map that illustrates Iowa’s changing population density over time, highlighting the gradual shift from river-dominated landscapes to those shaped by railroads (dotted black lines) and major roads (solid black lines).
Code and data are available at https://github.com/Maryamtd/BlueGap2024
Skills: Web Mapping, Geovisualization, Spatial Analysis.
Tools: D3.js, JavaScript & HTML & CSS.
D3.js Projects

https://geog3540.github.io/Maryam-Torkashvand
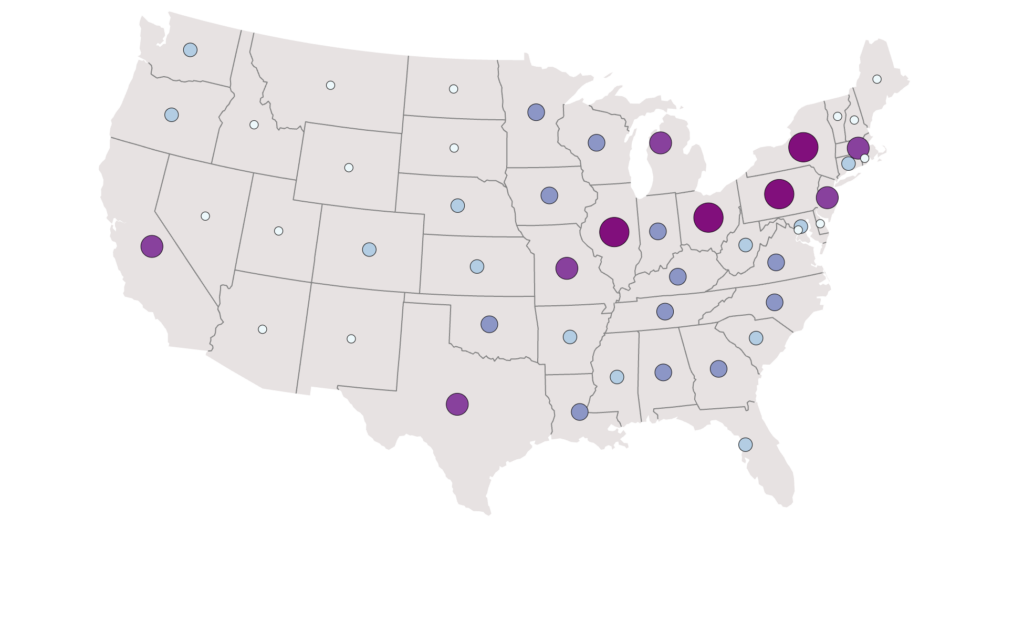
This collection showcases a variety of mapping techniques, including choropleth, proportional symbol, bivariate map, and flow map. These maps are built in Observable, with a focus on geovisualization.
Skills: Geovisualization, Map Design, Cartography, Data collection.
Tools: D3.js, Observable, Flow Mapper.
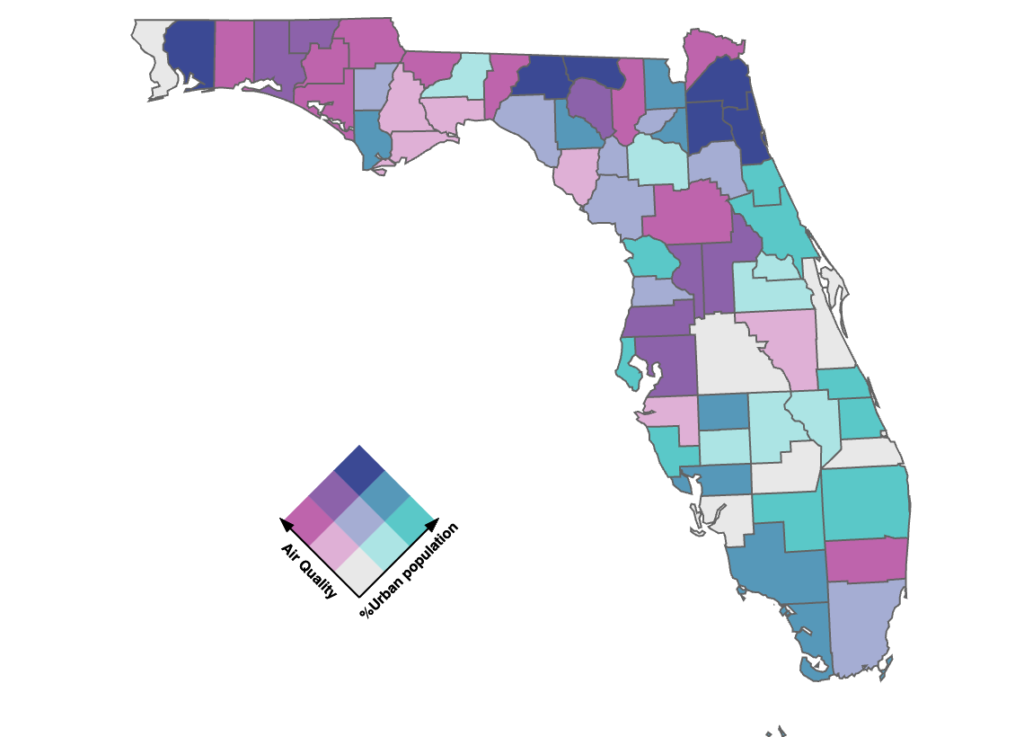
Web Mapping
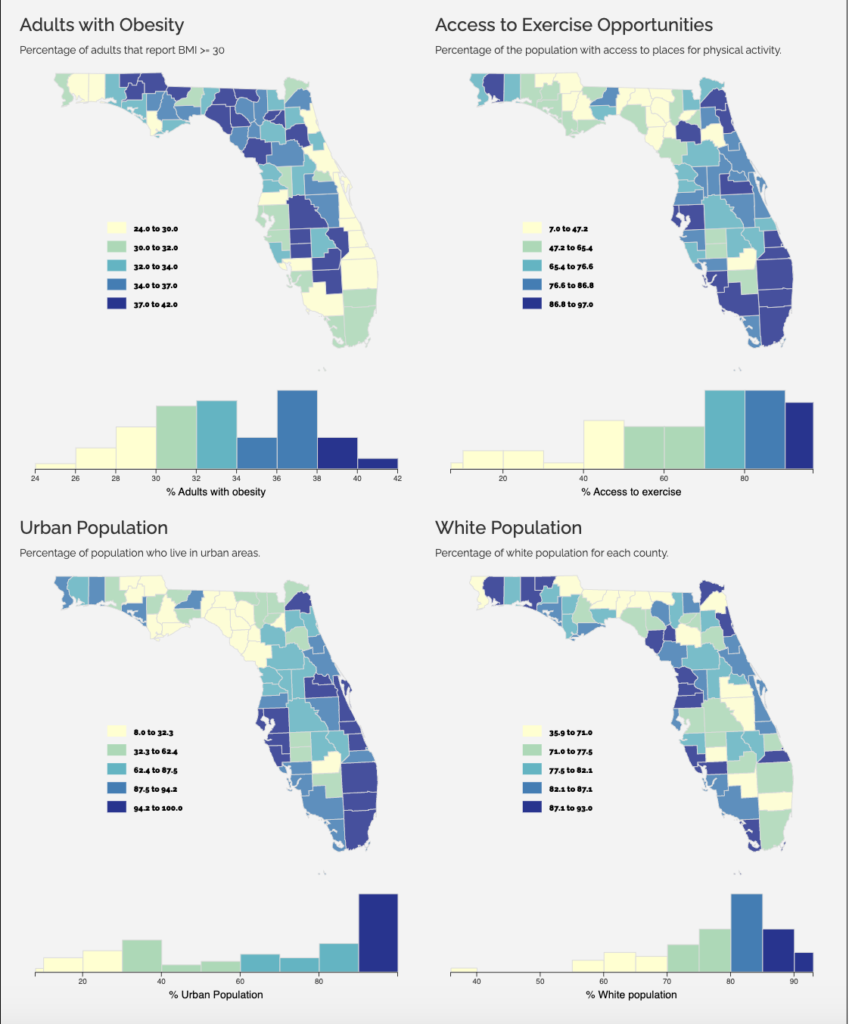
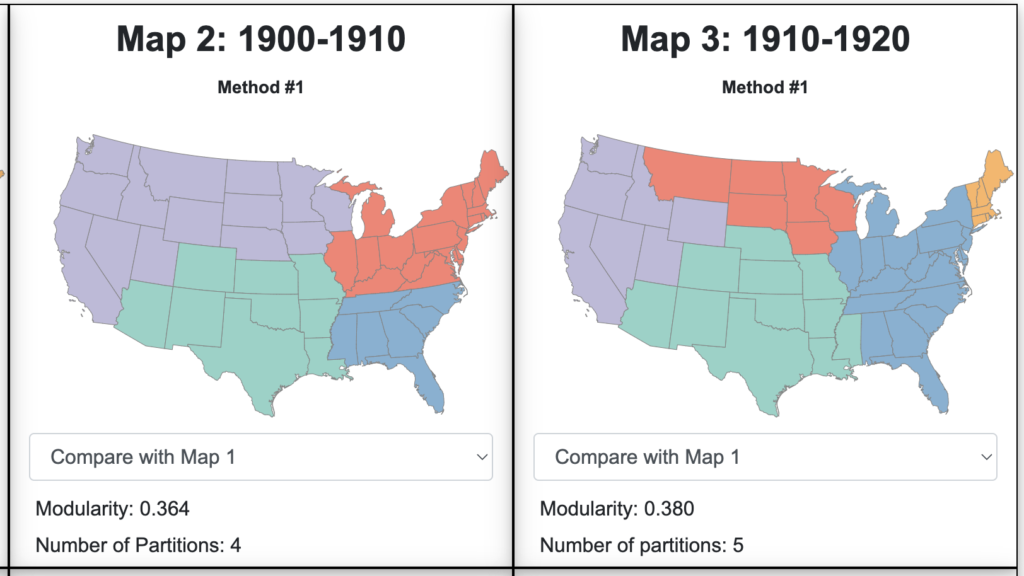
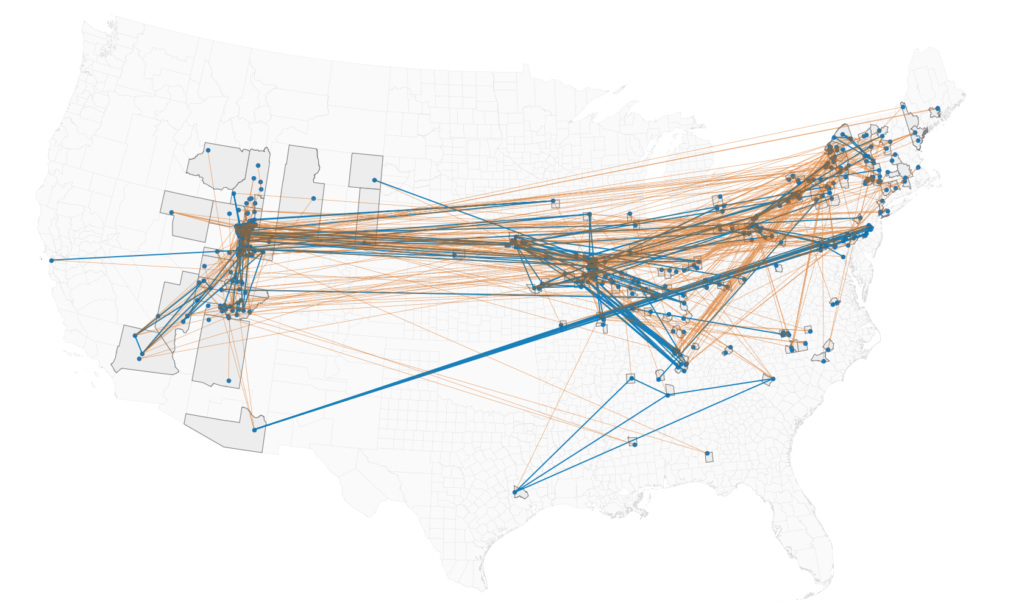
Interactive maps that include small multiple maps illustrating variable patterns in Florida, and a comparison of community detection algorithms for identifying migration regions in the U.S.
Skills: Web Mapping, Network Analysis, Spatial Analysis, Usability Testing.
Tools: Python, D3.js, JavaScript & HTML & CSS, Google Survey.
Spatial-Social Network
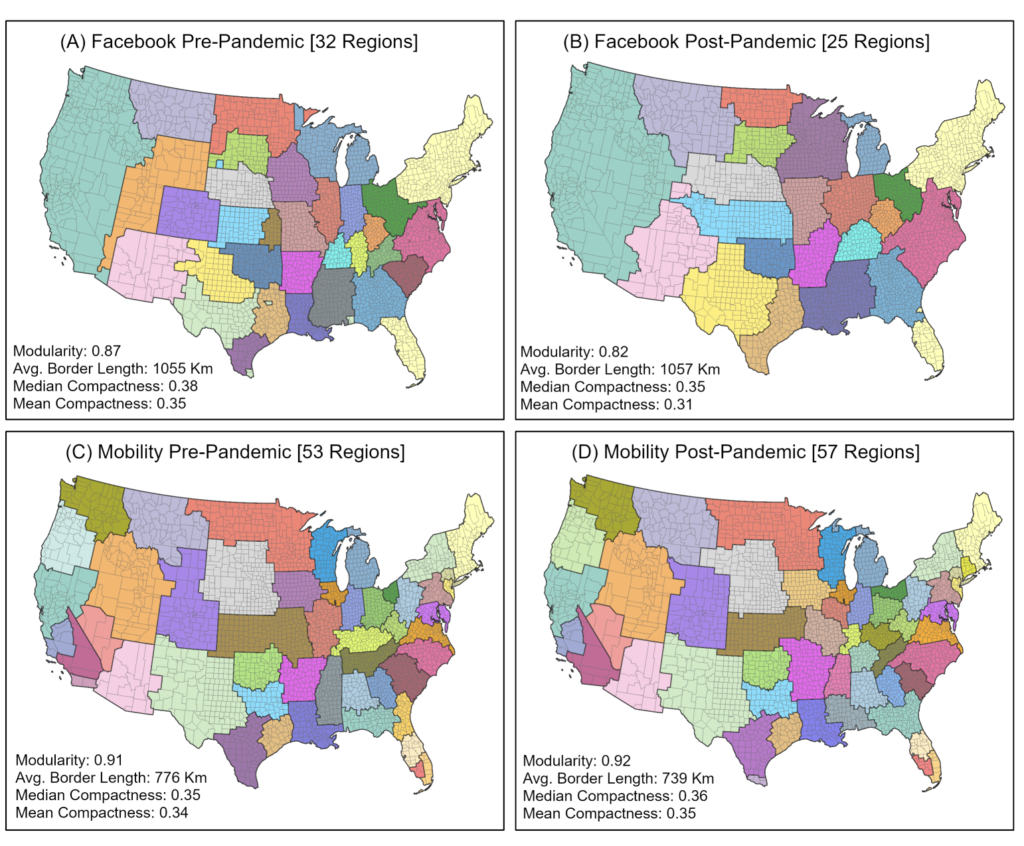
Using network community detection methods, I mapped and analyzed social connections across various topics within a spatial environment.
Mapping migration regions and their evolution from population-scale family trees.
The effect of disruptive events on spatial and social interactions.
Skills: Network Analysis, Spatial Data Analysis, Social Networks, Academic Writing, Academic Presentation.
Tools: ArcGISPro, Arcpy.
Geocoding (Toponym Resolution)
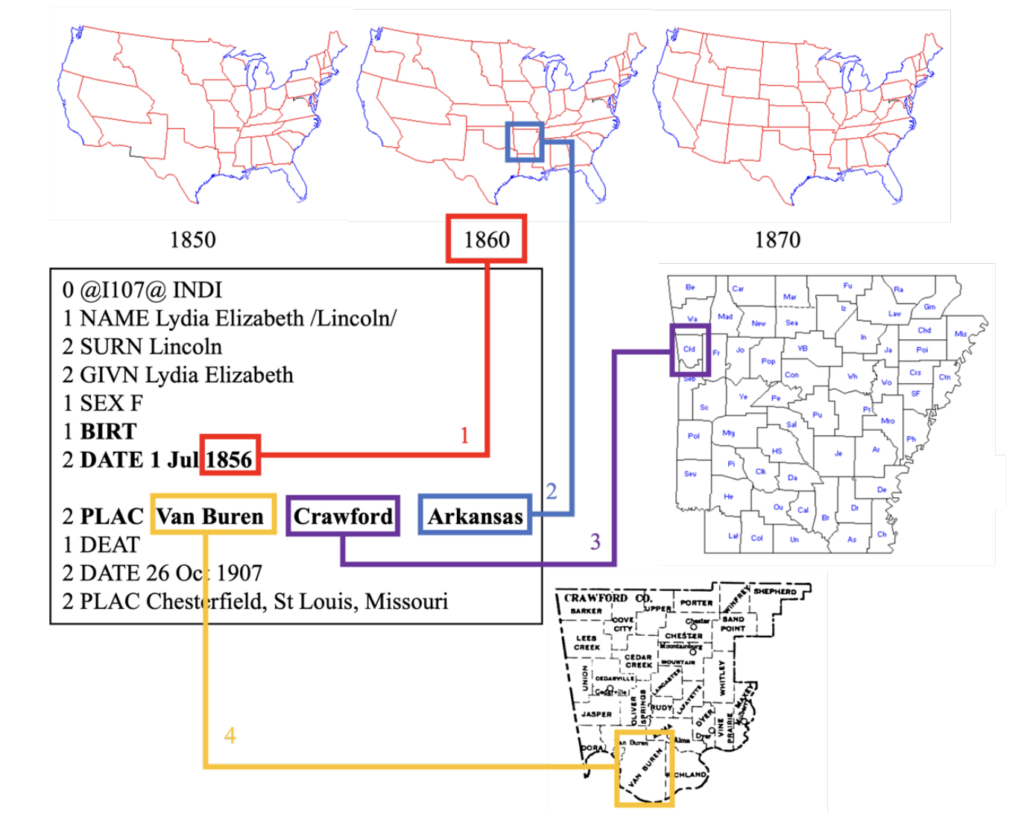
First Paper Award Winner at the CaGIS+UCGIS 2024 Conference. Developed a multi-step framework to resolve birthplace fields for over 25 million records in crowd-sourced genealogical data.
[Complete code, results, and data will be available with the final version of the under-review paper.]
Skills: Big Data Analysis, Data Cleaning, Relational Database Management, AI Validation, Project Management.
Tools: Python, PostgreSQL and PostGIS.
Groundwater Vulnerability and Risk Assessment
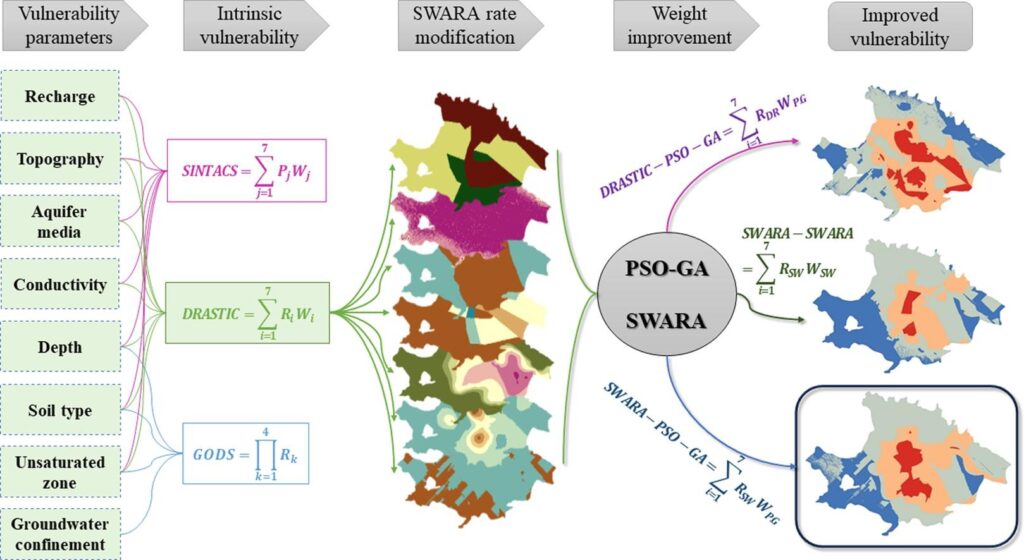
Integrated GIS modeling with various decision-making and optimization techniques to assess groundwater vulnerability and risk in different aquifers.
Skills: GIS Modeling, Multi-Criteria Decision Making, Optimization, Statistics, Academic Writing.
Tools: ArcMap, MATLAB, SPSS.
Spatial Kinship Networks (ongoing)
I’m building a spatial-social network dataset from a large, crowdsourced historical family tree to study how sibling and sibling-in-law ties shape migration and community structure over time.
Skills: Historical GIS & Cartography, Computational Social Network Analysis, Geo-social Network Analysis, Big Data Engineering & Analytics.
Tools: Python, PostgreSQL and PostGIS.
Spatio-temporal dynamics
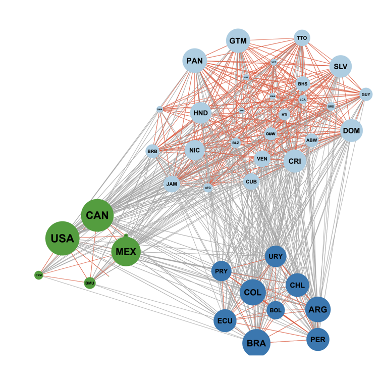
In the NSF-funded I-GUIDE Summer School, we explored the connection between countries, regions, and continents in merchandise and service trades before and after the COVID-19 pandemic.
Presenting the work as a session in the I-GUIDE Virtual Consulting Office.
Skills: Network Analysis, Geoethics, Team Work.
Tools: R, I-GUIDE Platform.
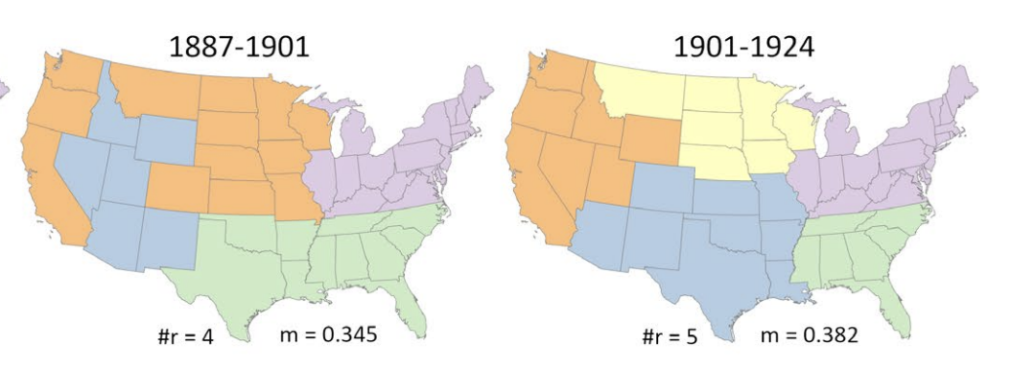
Mapping Temporal Regions
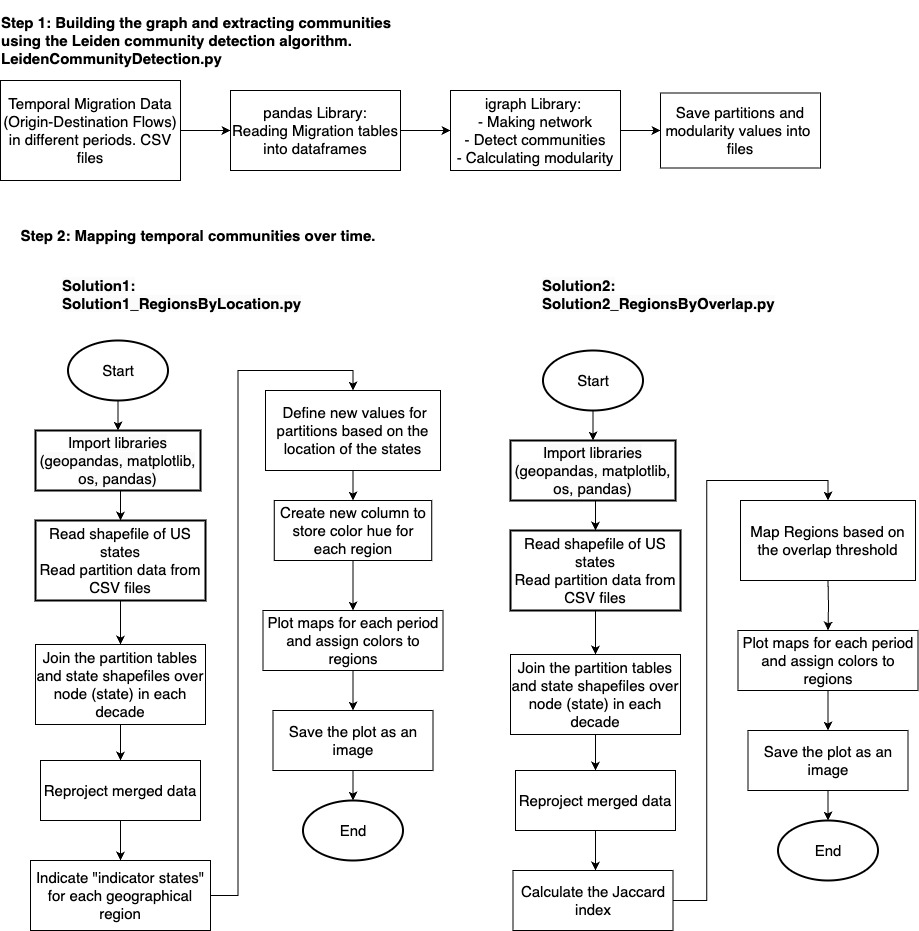
Developing and evaluating two solutions for automating the mapping of changes in spatial communities using Python programming.
https://github.com/geog3050/torkashvand/tree/main/project
Skills: Network Analysis, Spatial Analysis, Geo-programming.
Tools: Python, Geopandas.